Collect data from the web
Give the Agent URLs and the fields you need. Gather public product, company or content data into structured records, keeping source links and collection dates so your team can trace the numbers behind each chart.
YOUR DATA, A CLEARER PICTURE
Turn spreadsheets, web research and connected app data into a working dashboard. Teable Dashboard Creator helps you build KPIs, charts and filters, then schedule data collection to keep the overview useful.
Choose a source here; connect and authorize accounts in Teable.
Continue in Teable to generate your dashboard. Sign-in is required; AI tasks use credits.
Trusted by teams at













A dashboard brings key numbers, trends and the records behind them into one useful view. Start with a question: which deals need attention, where orders are delayed, or how demand changes each week. Teable turns your brief and data into a working dashboard you can refine through conversation. You do not need to design every chart before you begin, and you can add the underlying workflow when your team is ready.
Put the most important metrics first, compare trends over a consistent period, and keep categories easy to explore. Change the period below to see how an overview responds to its data. Use this as a starting point for your own brief, not as a fixed layout you have to adopt.
Orders
491
Completed
422
Completion rate
85.9%
| Week | Orders |
|---|---|
| 5 | 104 |
| 6 | 126 |
| 7 | 118 |
| 8 | 143 |
Go beyond a file upload. Combine public web data with records from the tools your team already uses, then build an overview around the questions you need answered. Connect and authorize your sources inside Teable.
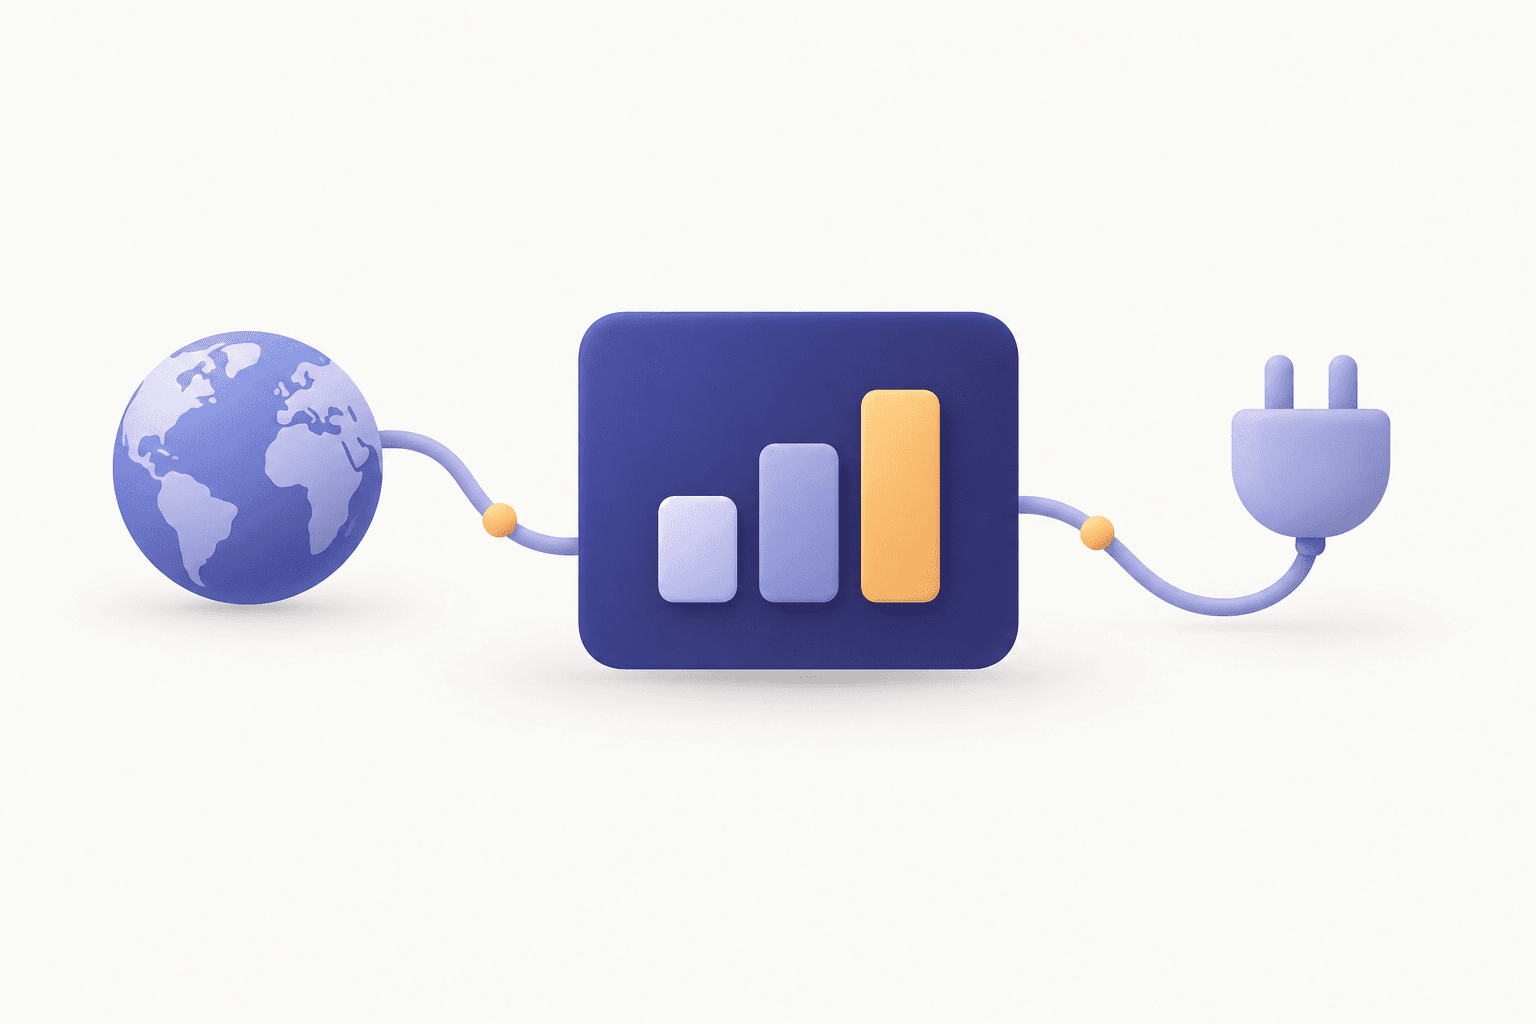
Give the Agent URLs and the fields you need. Gather public product, company or content data into structured records, keeping source links and collection dates so your team can trace the numbers behind each chart.
Bring inquiry emails from Gmail or contacts from Attio into the same workspace. Combine those records with your existing tables to see new inquiries, lead sources and follow-up status together, without repeatedly assembling exports.
Set up scheduled scraping or connector tasks to add new records and update existing ones. Choose an interval that suits the source and your reporting needs, such as a daily check or a weekly review, then use the updated records in your dashboard.

A useful business dashboard connects the summary to the work behind it. With Teable, you can develop the data, interface and follow-up process together. Start with a focused overview, then add the detail your team actually uses instead of filling the screen with every available number.
Dashboard Creator is not a fixed template. Shape its content and presentation around your work: choose the layout, colors, charts, metrics, filters and interactions. Describe the result you want, then keep refining it with the Agent.
Go beyond reading charts. Ask Teable Agent to compare periods, investigate a change, surface unusual records or summarize the findings. For a pipeline review, ask which deals need attention and have the Agent explain its reasoning from the records.
Tell the Agent what a completed order or qualified lead means. Specify the date field, filters, currency and calculation rules. Review a few totals against the source before sharing, especially when combining files with different structures. A clear definition makes comparisons meaningful.
Ask for a filtered list alongside your KPIs so the team can see which deals, requests or tasks need attention. Continue building forms and actions around those records when needed. The goal is to move from spotting a change to knowing what to do next.
Share the finished dashboard with colleagues, clients or partners using a link. Configure who can access it and the underlying data in Teable, so each audience gets the view they need.

Ask for another breakdown, a different period or a new chart as your questions change. For connected sources, configure data updates and scheduled automations in Teable at an appropriate interval. Uploading a file provides a starting dataset; it does not create a permanent connection to that file.
The best brief names the reader, the decision and the data available. These examples are starting points you can edit. Add your own fields or attach a representative file so the Agent can work with your actual business definitions.
01 / Sales leads
Bring together opportunities, owners and expected close dates. Compare open pipeline by stage and highlight deals without a recent follow-up, so the meeting ends with specific actions rather than another request for a spreadsheet.
02 / Operations teams
Track order volume, fulfilment status and overdue work. Keep a list of exceptions beneath the summary and separate order dates from shipping dates. That distinction helps the team answer whether demand increased or deliveries slowed down.
03 / Support managers
See open requests, age and ownership without reducing the queue to a single average. Group unresolved work by priority and show the records that need reassignment. Include response-time metrics only when the source contains the timestamps to calculate them.
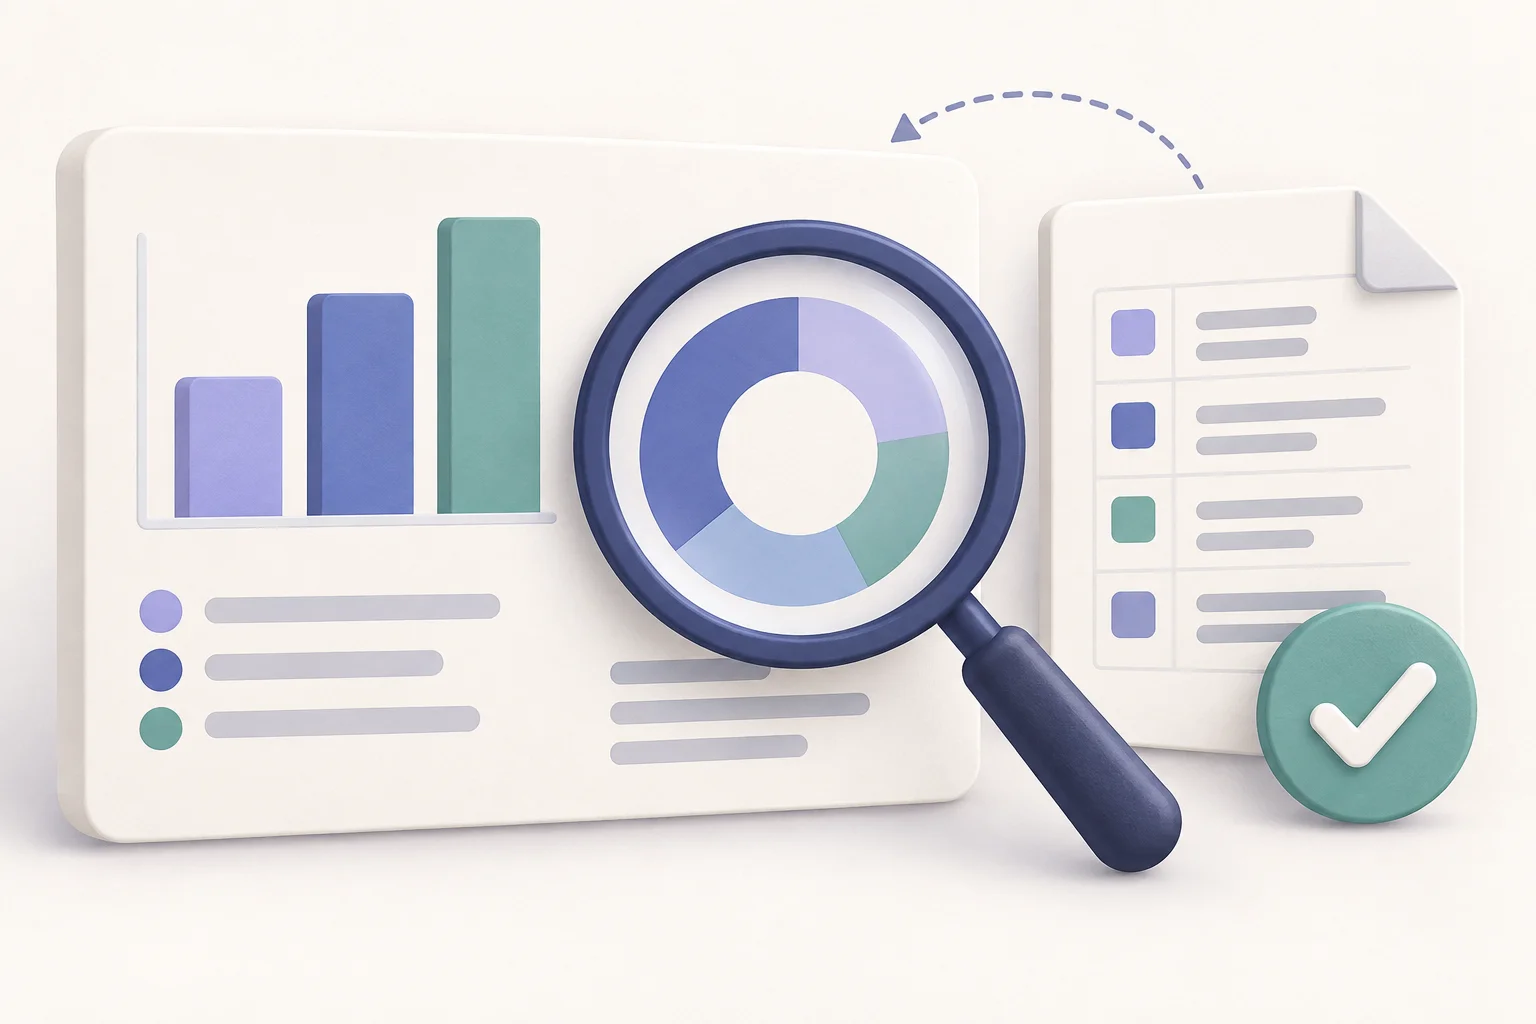
Describe the metrics, audience and reporting period. Attach a spreadsheet, provide public URLs to research, or name the apps you want to connect. In Teable, authorize those sources and specify which fields to collect before building your overview.
Continue in Teable and let the Agent build the dashboard. Review totals, missing values and filter behaviour using a small sample. Explain corrections in plain language rather than starting again whenever a chart needs adjusting.
Set the intended access, share the dashboard and gather feedback. Add new views or actions as the team uses it. When updates are needed, configure the source and schedule, then check a completed run before relying on it.
Feedback from people using Teable to connect their data, internal apps and everyday workflows.
AI Leader · Google DeepMind

I used Teable for a team with leads spread across sheets, CRM exports, and automations. We now import, follow up, and track dashboards in one flow. One system replaced half a dozen disconnected tools.
AI Systems Builder · AI SCWORK

🧨 Teable does not just compete with Airtable. It exposes what Airtable is missing. Modern teams do not need nicer spreadsheets. They need operational systems that can run themselves. Teable turns tables into workflows, AI actions, and internal apps.
AI Consultant & AI Engineer · Adway
Teable 3.0 feels like a grown-up spreadsheet. It keeps the familiar grid and adds automations, AI actions, and internal app building in one platform. I finally got the control model I used to assemble manually.
Yes. Attach your file and describe the questions you want the dashboard to answer. Clear column headings, consistent dates and one record per row make the data easier to interpret. If you use Google Sheets, export a file to start here or configure the available connection inside Teable.
Start with a file, public web pages or supported connected apps. For example, collect company information from the web and combine it with inquiry emails from Gmail or contacts from Attio. Connect accounts inside Teable, choose the fields to collect and define how matching records should be updated. You can also describe a new dataset to build from scratch.
Yes. Configure scheduled scraping or tasks that fetch data from connected apps, then use those records in the dashboard. Set a reasonable collection interval for each source and show the last update time alongside the reporting period. A one-time file upload supplies initial data; scheduled collection is configured separately in Teable.
You can keep asking the Agent to adjust the dashboard, including metrics, groupings, charts and filters. Explain the intended calculation and test it against known records. A request such as excluding cancelled orders should apply consistently to both the summary and detail views.
Configure permissions for the dashboard and its underlying data in Teable. Test the experience for each role before inviting the team. A chart filter is useful for analysis but should not be treated as a substitute for an access-control rule.
AI generation uses Teable credits. Available credits, sharing and other features depend on your plan. Check current pricing and try a focused task before expanding the scope; the work required varies with the data and dashboard complexity.
Give Dashboard Creator your files, public sources or connected-app requirements. Build an overview your team can keep updating and improving.

Products
AI app builder
No-code app builder
Excel to app
Spreadsheet to app
Dashboard Creator
AI project management
Online form builder
AI web scraper
Find Influencer
AI email parser
Workflow generator
All Products


